01
Opaque flows
No read on the field.
How flows actually behave stays invisible in conventional averages. Bottlenecks, delays and rework hide behind aggregated KPIs and gut feeling.
Starting February 23, you can access your NEXT application via the URL dedicated to your company, as indicated in the email you received.
If you run into any trouble, contact our support:
support.platform@agilea-group.com
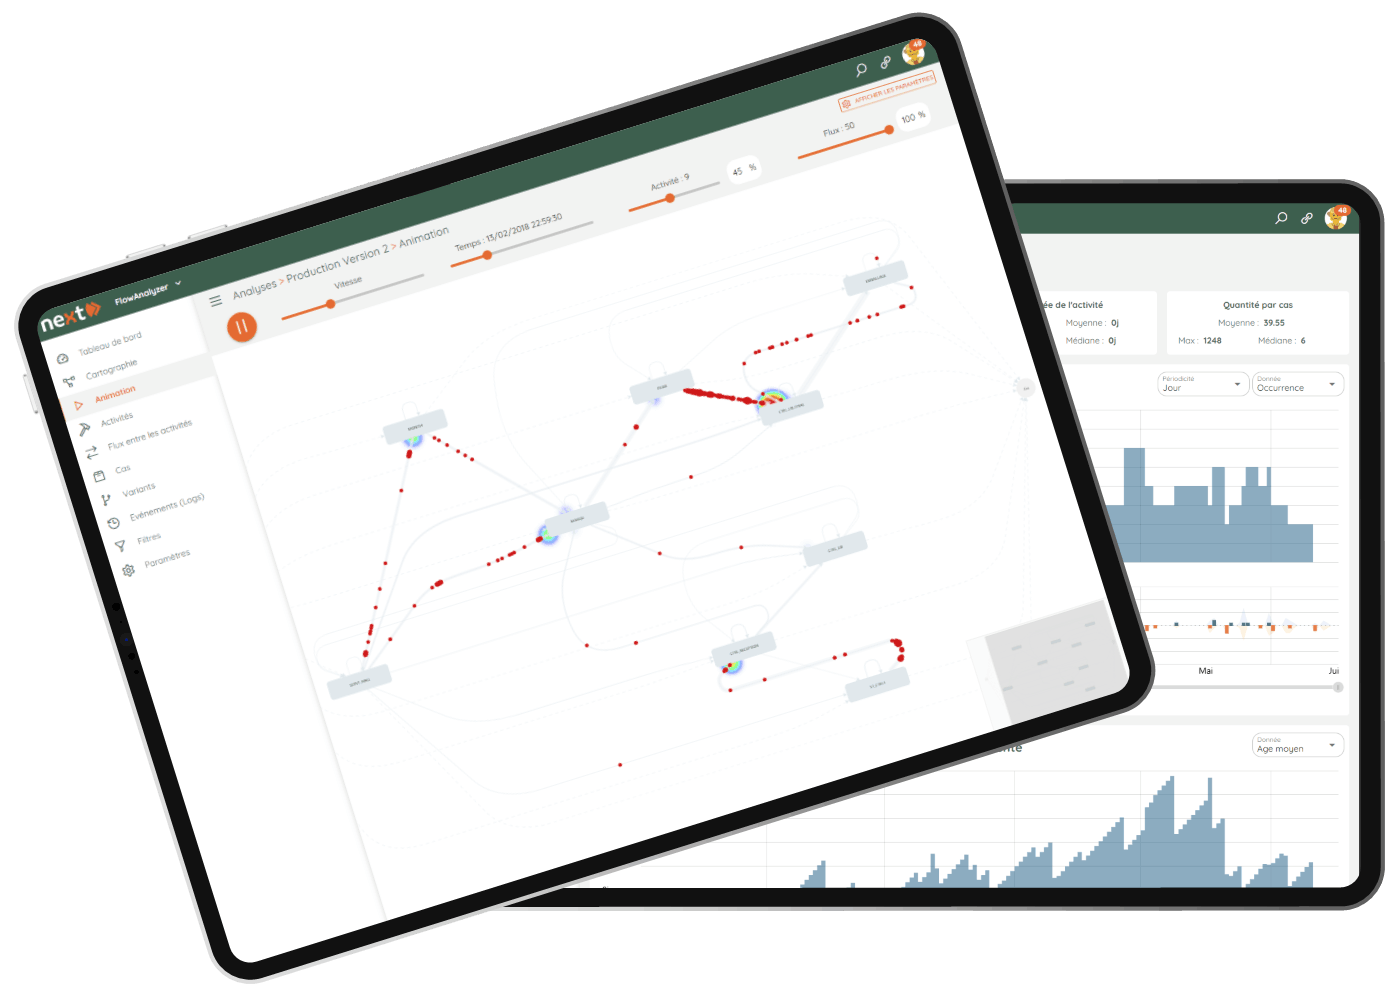
NEXT Application · Process mining
Reconstruct your flows from your own data to visualize bottlenecks, delays and rework — and prioritize your actions where the impact will be greatest.
−31%
of wait time identified
The challenge
Organizations lack a factual view of how their flows actually behave. Bottlenecks, accumulated delays and rework stay hidden behind averages or opinions — making it hard to prioritize improvement actions.
No read on the field.
How flows actually behave stays invisible in conventional averages. Bottlenecks, delays and rework hide behind aggregated KPIs and gut feeling.
No shared view.
Without a clear view of the longest cycles, teams don’t know where to act first. Improvement efforts scatter instead of targeting the highest-stakes flows.
Invisible loops.
Rework loops, instability and long cycles stay buried in “average” KPIs. Variability is the silent killer of flow performance.
The solution
FlowAnalyzer reconstructs your flows from logs and exports (ERP, MES, CRM…). It highlights flow intensity, the longest cycles and variability — to pinpoint where bottlenecks concentrate. No black box: no automatic recommendations, just readable, debatable data.
Reconstruction of real flows
The real process paths are reconstructed from event logs — not the process as it is designed.
Measures that matter
Lead time, wait time, work in progress (WIP), rework loops, variability — computed on your real data.
Interactive views
Filter by product, customer, period, team, channel and explore what really matters.
Your data, already there
Your systems already record what FlowAnalyzer needs: one time-stamped event per case. Import your logs and exports, and the flow reconstructs in a few minutes.
How it works
From your event logs to a shared map: four steps, a few minutes. Bottlenecks, queues and rework loops finally jump out at you.
Import
Your event logs and system exports (ERP, MES, CRM…).
Reconstruct
The real process paths, as executed.
Measure
Lead time, wait time, work in progress (WIP), rework, variability.
Explore
Filter, compare, spot bottleneck zones — and align teams.
Beyond the dashboard
Features
Map the process as it is actually executed — not as it is designed. Every variant, every delay, every rework loop, reconstructed from your data.
Load your event logs and system exports (ERP, MES, CRM…). No sensors, no heavy integration.
Filter by product, customer, period, team, channel. Explore what really matters.
Lead time, wait time, work in progress (WIP), rework loops, variability.
Highlight queues, friction points and zones of high variability.
The maps make problems obvious and foster more effective conversations.
Measurable impact
Typical results observed during flow-analysis deployments.
100 %
Factual visibility into how flows actually behave
Less
Time to identify bottlenecks and rework
More
Alignment, faster, on improvement priorities
1
A single factual view shared by all stakeholders
Results depend on scope, context and adoption discipline. No guarantee — orders of magnitude confirmed by real deployments.
NEXT platform
FlowAnalyzer shares a common data layer with the other NEXT applications — project management, flow analysis, field audits and skills — for a 360° operational view.
Process mining & flow reality
DemandAnalyser, Workspaces…
The NEXT ecosystem keeps growing.
They use it
The flow maps let us see exactly where wait time was piling up and align the team on a few simple, high-value actions.
Before FlowAnalyzer, we debated priorities endlessly. Now we have a shared factual view that speeds up decisions.
We identified rework loops we didn’t even know existed. The visual maps made the problems obvious and triggered immediate action.
Frequently asked questions
An analytical discipline that reconstructs and visualizes an organization’s real processes from the event logs of its systems (ERP, MES, CRM…). Unlike traditional mapping — interviews and assumptions — it reveals what really happens: paths taken, time spent at each step, variability between cases and rework patterns. An objective foundation for improvement.
Agilea’s process mining application. It ingests your event logs and reconstructs a visual map of your real flows — intensity, cycle times, accumulating delays, rework loops. Designed for operational teams, it turns opaque data into a clear, shared read that informs decisions.
Any process that leaves a digital trace: manufacturing orders, purchase-to-pay, order-to-cash, patient journeys, IT ticket handling, logistics flows… Whether industrial, administrative or service-based, process mining makes them visible and measurable.
Documentation describes how things should work. In practice, flows drift: workarounds, exceptions that became routine, unplanned paths. Process mining captures reality — every variant, every delay, every loop — so you start from facts, not assumptions.
Event logs and exports from your existing tools: ERP, MES, CRM, LIMS, ticketing… Each line = a time-stamped event tied to a case (order, ticket, batch…). No complex integration or additional sensors: your systems already record what FlowAnalyzer needs.
A BI dashboard displays aggregated KPIs — averages, volumes, rates. Process mining reconstructs the individual journey of each case to reveal paths, variability between cases and bottleneck zones. It shows the “how” behind the numbers — invisible in standard reporting.
Lean and CI rely on the objective observation of flows (gemba, VSM). Process mining digitizes that observation at scale: cycle-time variability, rework patterns, wait zones across thousands of cases — a factual starting point for every kaizen workshop or DMAIC cycle.
No. FlowAnalyzer focuses on the reality observed in execution data, with no theoretical model or standard times. The goal: make flows readable and debatable so teams identify the levers themselves — starting from what actually happens.
Once the data is imported, FlowAnalyzer reconstructs the flows in a few minutes. Preparation time depends on the quality and availability of your logs, but a first readable map is usually available within a few hours.
Yes. It is integrated into Agilea’s NEXT ecosystem, alongside TaskFlow (flow-based project management), ProcessEval (shop-floor / field audits), SkillFlow (skills) and other applications. Each application shares a common data layer, for a 360° operational view.
Ready to see your flows?
Discover how FlowAnalyzer maps your flows so you can decide fast and right, as a team, from a shared factual view.
Release notes
NEXT evolves continuously. Here are the platform's most recent versions.